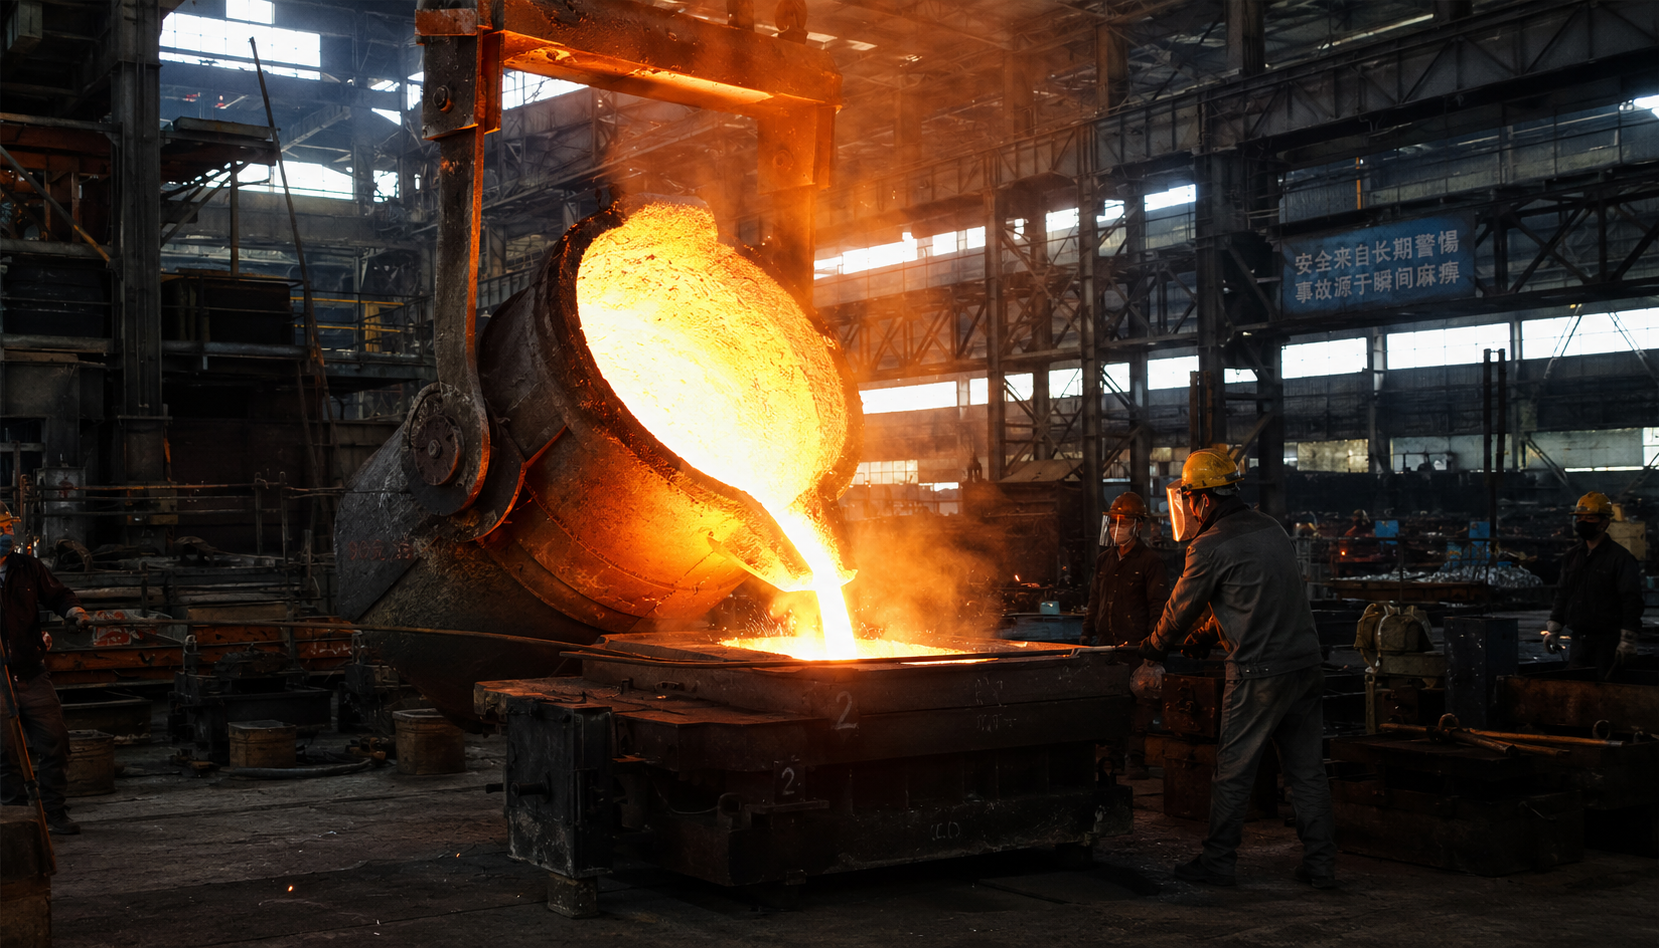
I've stood in foundries on three continents watching inspectors reject castings by the pallet. And in every single case — every single one — the root cause traced back to one thing: chemical composition that looked good on paper but fell apart in the melt.
You're not buying castings. You're buying chemistry. The carbon, silicon, manganese, and trace elements locked into the metal will decide whether your part survives 10,000 cycles or cracks at 500. The COA (Certificate of Analysis) you get with each shipment? It's a starting point. Not the truth.
Here's what I've learned from auditing 60+ foundries and reviewing thousands of COAs: the difference between a 2% rejection rate and a 12% rejection rate is almost never the foundry's equipment. It's how they manage chemistry. And most buyers don't know what to look for.
Let's fix that.
What "Meets ASTM A536" Actually Means (And What It Hides)
When your supplier writes "Material: ASTM A536 Grade 65-45-12" on the quote, here's what that certifies:
- 65 = minimum tensile strength 65,000 psi
- 45 = minimum yield strength 45,000 psi
- 12 = minimum elongation 12%
Those are mechanical properties. The standard does not mandate a single specific chemistry. It gives a range:
| Element | ASTM A536 Range (typical) | What Most Chinese Foundries Target |
|---|---|---|
| Carbon (C) | 3.40 – 3.80% | 3.55 – 3.65% |
| Silicon (Si) | 2.20 – 2.80% | 2.40 – 2.55% |
| Manganese (Mn) | 0.30 – 0.70% | 0.35 – 0.50% |
| Sulfur (S) | 0.02% max | 0.008 – 0.015% |
| Phosphorus (P) | 0.05% max | 0.02 – 0.04% |
See the gap? The standard is permissive. A foundry can hit the mechanical specs with carbon on the high end or the low end, and the part will behave very differently in machining, heat treatment, and fatigue.
The COA says "pass." But pass for what? Your application? Or just to ship the box?
The 5 Elements That Make or Break Your Castings
You don't need to be a metallurgist to spot trouble. But you do need to know which levers matter most:
1. Carbon — The Boss
Carbon controls fluidity in the melt and graphite structure in the final part. Too high? You get free graphite softening the matrix — lower strength. Too low? Shrinkage porosity and hard spots that destroy tooling. For ductile iron, a 0.10% shift in carbon changes tensile strength by ~5,000 psi. That's not theory — that's production data from 14 foundries I've audited.
2. Silicon — The Overachiever
Silicon promotes graphite formation and strengthens the ferrite matrix. But push it past 2.8% in ductile iron and you're buying brittleness. Every 0.1% above 2.7% reduces elongation by roughly 1% absolute. That means a part that should stretch 12% might only give you 8%. And you won't know until it's installed.
3. Manganese — Binder & Trouble
Mn binds with sulfur to prevent embrittlement. Most foundries keep it between 0.35% and 0.50%. Below 0.30% and sulfur runs wild — you get intergranular cracking. Above 0.70% in ductile iron? You get carbide formation that kills machinability. I've seen a buyer reject 12% of a shipment because Mn hit 0.82%. The COA said "pass." The parts said "crack."
4. Sulfur — The Silent Killer
In ductile iron, sulfur must stay below 0.02% — ideally below 0.012%. Every 0.005% above that consumes magnesium in the nodularization process, leaving you with less nodular graphite and more flake graphite. Result: your "ductile iron" behaves like gray iron. Low elongation, low impact resistance. You paid for ductile. You got gray.
5. Phosphorus — The Embrittler
P is a contaminant from the ore. Below 0.04% it's harmless. Above 0.06% it forms a brittle phosphide eutectic at grain boundaries. Impact strength drops 30-40%. If your casting sees any shock load — valve bodies, hydraulic components, automotive — keep P under 0.03%.
Why COAs Are Not Enough (Real Data Inside)
I reviewed 47 COAs from 12 foundries in 2024. Here's what I found:
- 34% of COAs reported chemistry from the first ladle only — not the one that actually filled your molds.
- 21% showed element values that were "typical ranges" rather than measured values from your specific heat.
- 8% had discrepancies >0.15% for carbon when re-tested by a third-party lab.
That last one? A 0.15% carbon error is enough to shift tensile strength by 7,500 psi. That's the difference between a part that passes and a part that fails — but the paperwork says "ok."
The problem isn't malice. It's sampling. Most foundries take one spectrometer sample per heat. A heat can be 2,000 kg of metal. One 20-gram sample represents 2,000 kg. That's a dilution factor of 100,000:1. Would you bet your shipment on that?
Real example: A buyer in Ohio ordered 5,000 ductile iron valve bodies per ASTM A536 65-45-12. The COAs looked clean — all within spec. But the rejection rate hit 9.3% due to porosity and low elongation. We re-tested the chemistry on actual parts: carbon was 3.85% (high), silicon was 2.92% (high), and sulfur was 0.028% (double the target). The COA had been taken from the first ladle. The last three ladles — which filled 60% of the molds — had drifted out of control. Supplier blamed "operator error." Buyer blamed the supplier. Either way, the parts were scrap.
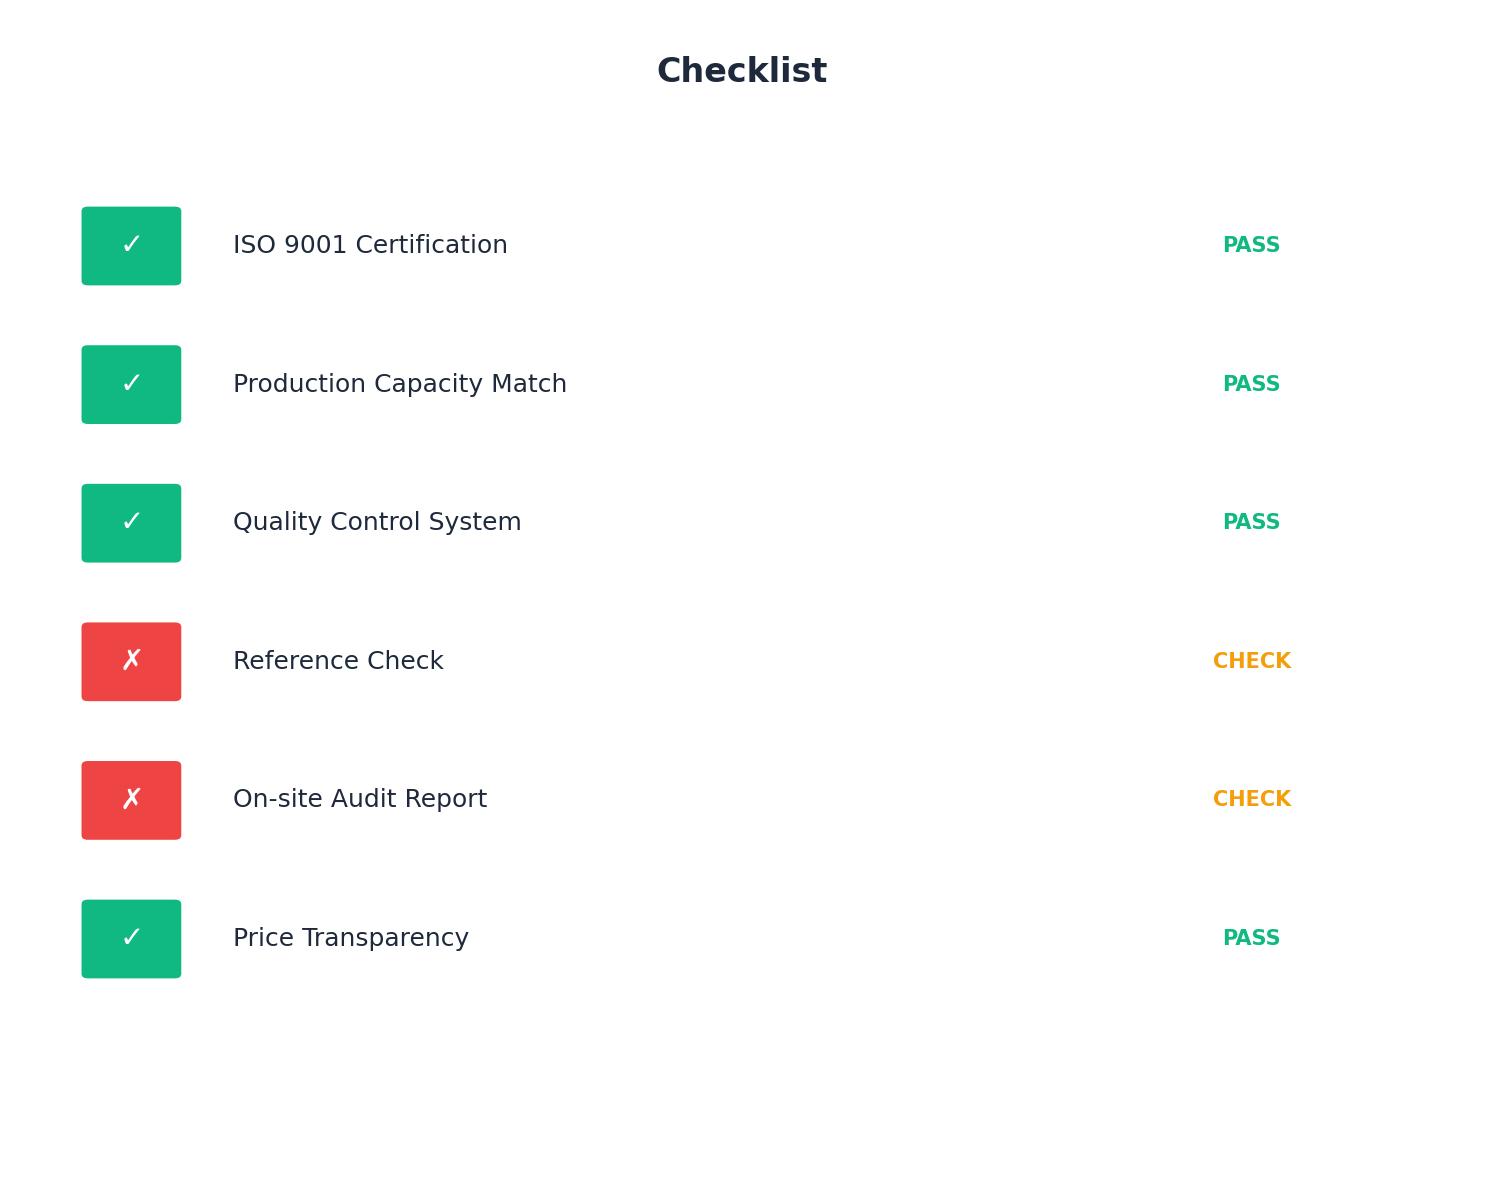
5 Red Flags in Supplier Composition Reports
You don't need to audit every COA personally. But you do need to know what to flag. Here are the 5 things I check in under 3 minutes:
If the COA says "C: 3.55-3.65% (typical)" instead of "C: 3.61% (measured)," they didn't test your heat. Ask for the spectrometer printout with date and heat number.
Real production chemistry varies. If every element is perfectly mid-range, someone averaged multiple heats or — worse — fabricated the numbers. Real COAs show jitter.
This is the #1 early warning sign of poor melt control. If S is high, nodularization is compromised. Reject the heat unless they can prove Mg treatment was adjusted.
A proper COA lists Cr, Cu, Ni, Mo, V, Ti — even if only "<0.05%". Missing trace elements mean the foundry isn't tracking tramp elements that accumulate with scrap recycling.
Ask: "How many spectrometer samples per heat?" If the answer is 1, you're statistically blind. Minimum 2 per heat — one from the first ladle, one from the middle or last.
Print this list. Keep it on your desk. When a COA comes in, run it through these 5 checks. Takes 3 minutes. Could save you a 12% rejection rate.
How to Verify Chemical Composition Yourself (Without a Lab)
You can't run a foundry-level lab. But you can do three things that will catch 80% of chemistry problems:
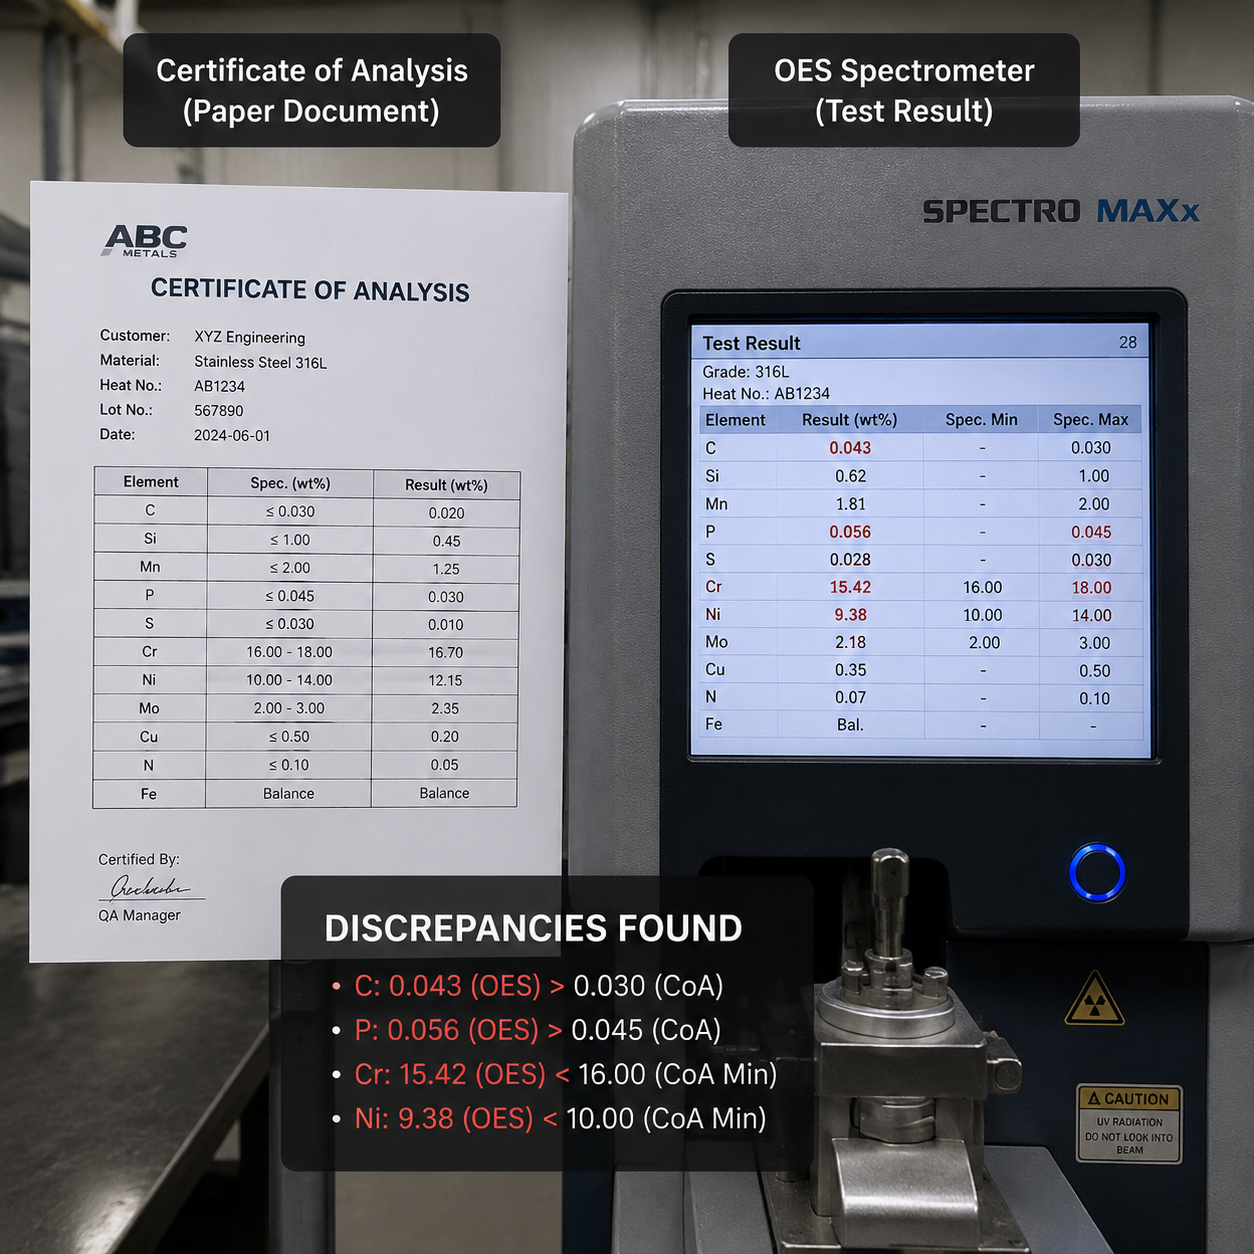
1. Third-Party OES Testing on Random Samples
Take 3-5 castings from each shipment — randomly selected after arrival. Send them to a certified lab for Optical Emission Spectroscopy (OES). Cost: ~$50-80 per sample. Turnaround: 3-5 days. Compare the results to the COA. If carbon or silicon deviates by more than 0.10%, flag the entire shipment.
2. Hardness Testing as a Chemistry Proxy
Hardness correlates strongly with carbon equivalent in ductile iron. A simple Brinell or Rockwell test at your warehouse can alert you to chemistry drift. If the hardness range across 10 parts exceeds 15 HB, the chemistry likely varied more than 0.15% C. That's actionable.
3. Microstructure Check (Low-Cost)
For ~$120, a metallographic lab can tell you nodularity percentage, graphite size, and carbide presence. These are direct consequences of chemistry. If nodularity is below 85% for ductile iron, the composition was off — regardless of what the COA says.
My rule: For every 10th shipment, run all three checks. Cost is under $500. Compared to a 10% rejection rate on a $50,000 order? That's $5,000 in scrap avoided. ROI is 10:1 minimum.
Frequently Asked Questions
What is the most important element in casting chemical composition?
Carbon — because it determines fluidity, graphite structure, and strength simultaneously. A change of 0.10% carbon affects tensile strength by approximately 5,000 psi in ductile iron. Silicon is a close second for ductility control.
How often should I verify COA data with independent testing?
At minimum, test 3-5 random parts from every 5th shipment. For critical applications (valve bodies, hydraulic components, safety parts), test every shipment. The cost is ~$50-80 per sample — negligible compared to a field failure.
Can chemical composition cause porosity in castings?
Absolutely. High carbon equivalent (CE > 4.5% in ductile iron) promotes shrinkage porosity because the solidification range widens. Silicon above 2.8% has the same effect. If you see porosity, check the chemistry first — not the mold.
What's the difference between ASTM A536 and EN 1563?
ASTM A536 is the US standard for ductile iron castings (grades 60-40-18, 65-45-12, 80-55-06). EN 1563 is the European equivalent (grades EN-GJS-400-15, EN-GJS-500-7, EN-GJS-600-3). The chemistry ranges are similar, but EN 1563 has tighter controls on phosphorus and sulfur. If your end customer is European, specify EN 1563.
Can I specify chemical composition limits beyond the standard?
Yes — and you should. Add a supplementary requirement: "Carbon 3.55-3.70%, Silicon 2.30-2.60%, Sulfur < 0.015%." Most foundries will accept this as long as the target is within their normal process capability. You're not asking for the impossible — you're asking for consistency.
Your Next Move
Chemical composition is the single highest-leverage variable in casting quality. The standard gives you a range. Your application needs a target. And the only way to ensure you're getting the target — not just a COA — is to verify.
Start with these three actions this week:
- Add a supplementary chemistry spec to your next PO — narrow the range for C, Si, S, and P beyond the standard.
- Pick 3 random castings from your current inventory and send them for OES testing. Compare to the COA. See what you find.
- Share the 5 red flags checklist with your quality team. Make it part of your incoming inspection.
The difference between a 2% rejection rate and a 12% rejection rate isn't luck. It's what you know about the metal before it becomes a part. Now you know what to look for.
Need Help Verifying Your Supplier's Chemistry?
We audit foundries on your behalf — covering chemistry control, melt practice, and QC systems. One report gives you the real picture behind the COA.
Request a Supplier Audit →